geotrack
An intelligent location analysis platform designed to visualize and interpret the movement patterns of tracked targets. By aggregating geolocation data over time, the system enables users to identify frequently visited areas, detect behavioral trends, and uncover patterns of group activity when multiple targets converge at the same location.
TASK
Develop a web and mobile platform that centralizes geolocation data, enabling users to visualize movement histories, identify key locations, and detect group interactions among multiple targets.
ROLE
UI Design
UX Design
UX Research
TEAM DISTRIBUTON
2 Product Designer (UI/UX)
PROJECT INCLUDES
UI/UX Design
Final Design
Prototype
COMPANY
Pensieve Digital Indonesia for Anonymous Government institution
YEAR
2024-2025
This case study has been adapted in compliance with a non-disclosure agreement. Certain elements such as brand names, product names, visual styles, and key features have been modified. However, the core use cases and user needs remain representative of the original work.
BACKGROUND
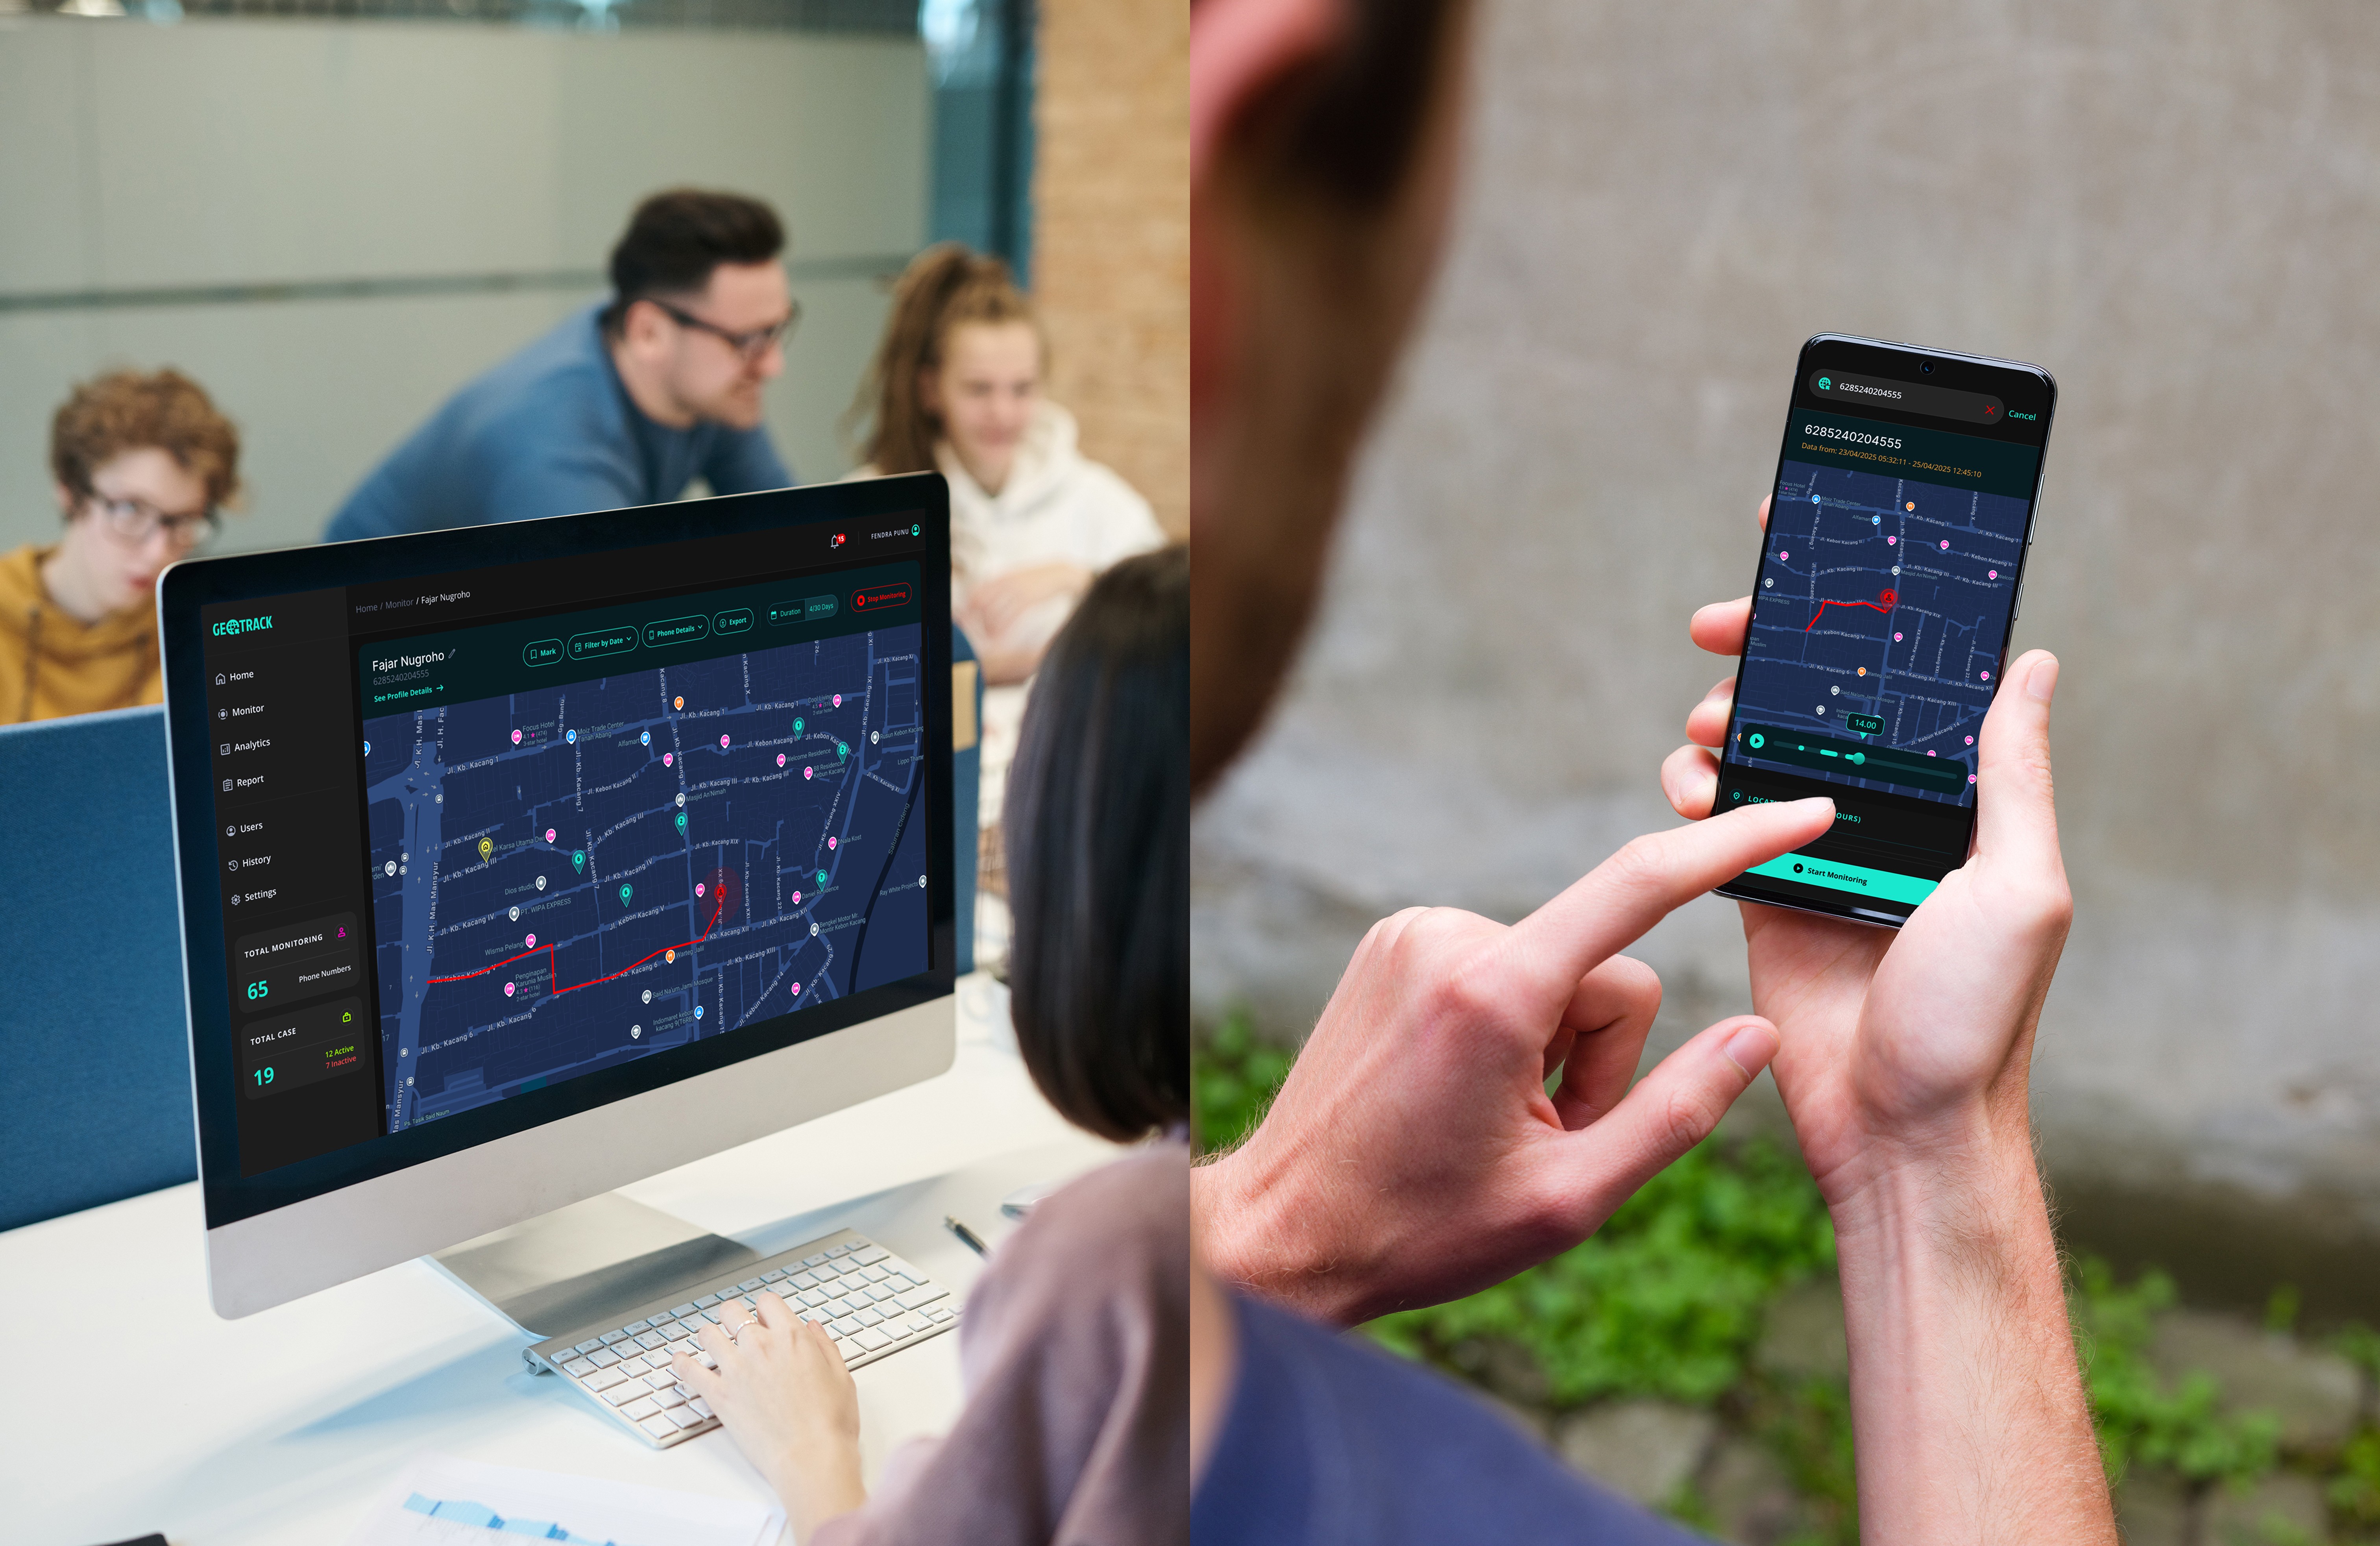
In the cybersecurity and defense sector, understanding a target’s movement is critical for threat assessment and operational planning. Our client needed a system to track potential suspects, reveal their most frequently visited locations, and detect patterns in their movements over time. They also required the ability to identify when multiple suspects visited the same location, helping to uncover possible connections and group activities.
The solution leveraged data from BTS (Base Transceiver Station) devices to generate precise location histories and visualize them on an interactive dashboard. As the Product Designer, my role was to translate these complex datasets into clear, actionable insights. This involved studying BTS technology, understanding technical constraints, and designing an interface that allows users to easily monitor targets, analyze movement patterns, and identify behavioral trends.

BTS (Base Transceiver Station)
A BTS is a transmitter station that sends and receives radio signals to communication devices such as landlines, mobile phones, and other gadgets. Its structures vary, from square or triangular bases to long cylindrical poles.
SYSTEM ARCITECTURE PROCESS
This process describes the development, design, and integration steps that enable and optimize the platform’s core operations.

IDEA GENERATION
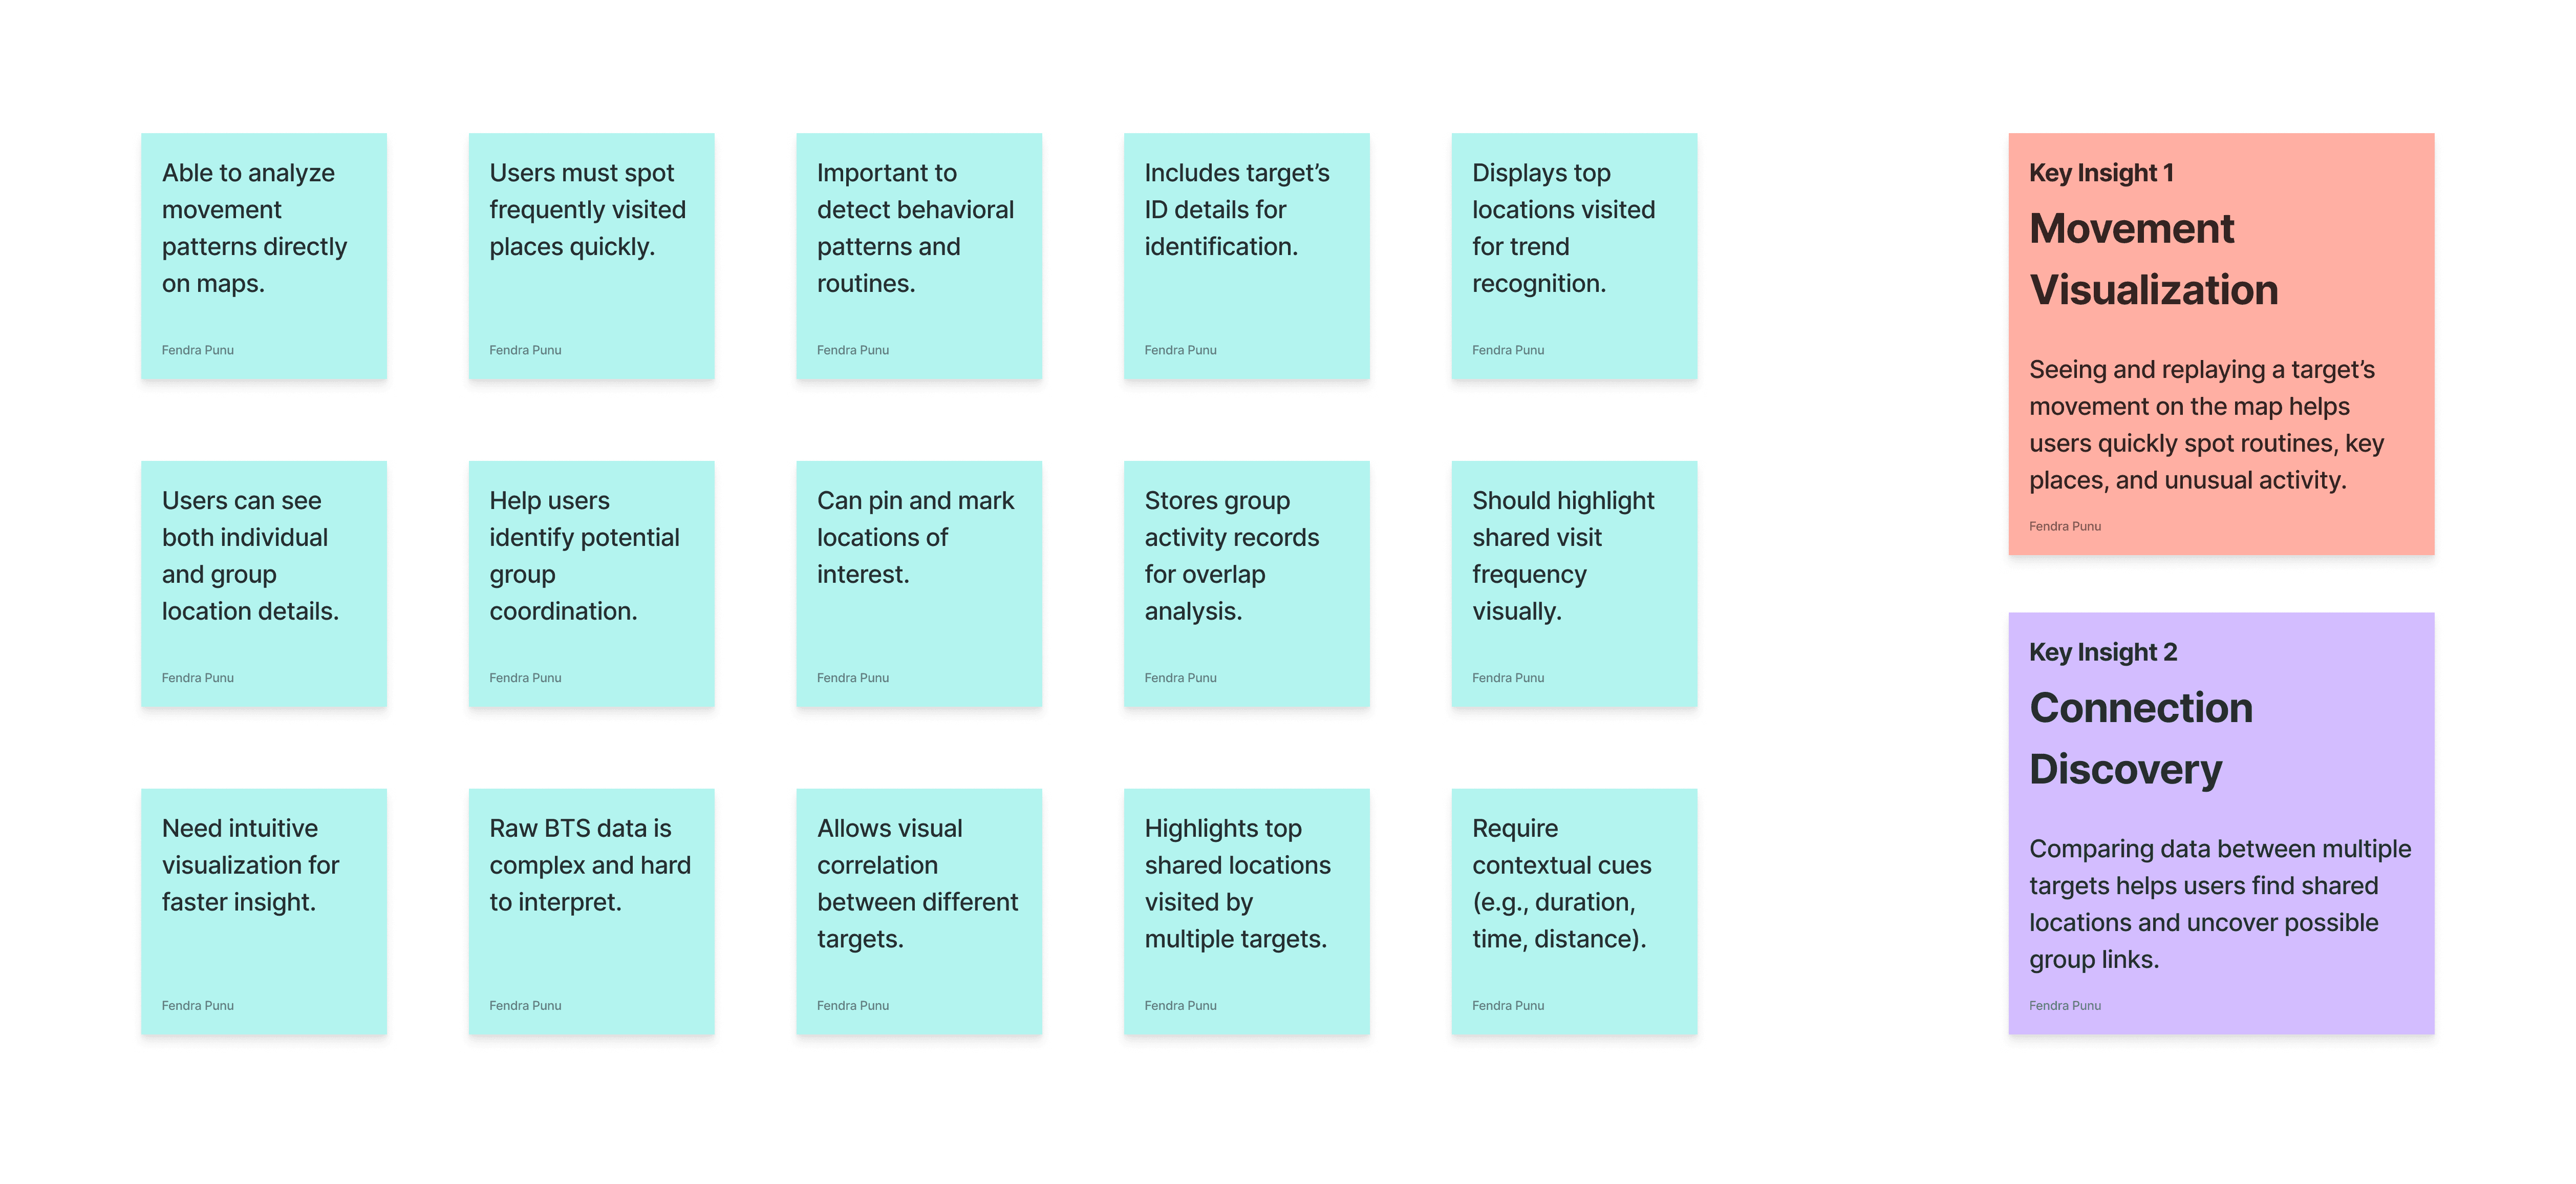
As a UI/UX designer, I led the idea generation and affinity mapping process to organize our team’s thoughts and findings. This helped me and the team identify key user needs, group common themes, and uncover insights that guided our design direction and solution development.
FROM INSIGHTS TO DESIGN DIRECTION
From the two key insights gathered through team collaboration, I identified the essential aspects that needed to be addressed. These insights were then developed into user stories and How Might We statements, guiding the design exploration and shaping the direction of the product development.
UNDERSTAND THE USER'S NEEDS
🙋🏻
As a user, I want to replay and visualize an individual’s movement pattern on the map, so I can understand their behavior timeline and identify critical or suspicious locations.
🙋🏿♂️
As a user, I want to compare multiple targets’ top visited locations and activity records, so I can detect overlapping visits and potential group coordination.
THE CHALLENGE
👷🏾
How might we help users intuitively explore and replay a target’s movement pattern to uncover key behavioral insights and identify patterns of interest?
👷🏻♀️
How might we enable users to compare individual and group data seamlessly to identify shared locations, synchronized movements, and possible connections between targets?
DESIGN STRATEGIES
Simplify Complex Data
Transform raw BTS location data into a clear, visual format that can be quickly understood.
Pattern Recognition
Enable users to easily identify frequently visited locations and movement patterns over specific timeframes.
Group Movement Detection
Highlight when multiple targets visit the same location to uncover possible connections.
Operational Efficiency
Provide a dashboard that allows quick filtering, time-based analysis, and actionable insights for faster decision-making.
CONCEPT MODEL
To ensure the proposed solution aligns with user needs and business goals, I developed a concept model based on insights from segmented users and design ideation with the engineering, PM, and business teams.

INFORMATION ARCHTECHTURE
After aligning with the PM on the key features to be developed, I designed the information architecture to ensure a clear and efficient navigation flow during development. The flow below represents a simplified version created specifically for this portfolio showcase; in the real application, the flow is more complex and detailed.

USER FLOW
Next, I created a user flow to illustrate the steps users take to reach their goals. The purpose of this flow is also to evaluate whether the journey is clear, efficient, and straightforward, ensuring users can achieve their tasks easily without unnecessary friction.

INITIAL INTERFACE
After that, I translated the user flow into initial interaction and interface designs to visualize how the flow would work in the actual app. The wireframes also served as a benchmark for developing the initial high-fidelity UI of the desktop version.

KET FEATURES
Location Log (24 Hours)
Displays the locations visited or passed by one or multiple targets within a 24-hour period.
It helps analysts identify movement patterns, travel frequency, and points of interest used for deeper behavioral analysis.
Pinned Location
Allows users to mark and track frequently visited or significant locations. The system records the number of visits, helping analysts prioritize areas that show high activity or repeated presence.
Activity Record
Shows the chronological activity history of each target, including visits to pinned locations or meetings with other targets. This feature helps analysts trace patterns of interaction and potential coordination between individuals.
Location Correlation
Reveals two types of correlation data: By Pinned Location – when multiple targets visit or meet at the same pinned place. By Meeting Time – when they appear at the same location on the same date.
Timestamp Record
Provides detailed, time-stamped logs of each target’s movement, showing exact dates and hours. It enables accurate tracking and timeline reconstruction for investigation or reporting purposes.
Phone Details
Displays detailed information including IMEI number, device model, registration date, and usage history. This allows analysts to verify device identities and monitor transitions between different phones or SIM cards.
ID Data Details
Connects with an external database to show registered ID information based on Indonesia’s SIM registration rules. It helps analysts identify the real owner behind a monitored number for validation and profiling.
Location Overview
Shows the total number of monitored targets by city and province on an interactive map displayed on the homepage. This feature gives a quick summary of monitoring coverage and overall target distribution across Indonesia.
THE SOLUTION
This is the final design implementing the proposed solution, following an ideal linear process for portfolio presentation. In real development, the design went through multiple iterations, discussions, and back-and-forth reviews with the Product Manager, Engineering, and Business teams.
Solution 1: Individual Movement Analysis
🙋🏻
As a user, I want to replay and visualize an individual’s movement pattern on the map, so I can understand their behavior timeline and identify critical or suspicious locations.
👷🏾
How might we help users intuitively explore and replay a target’s movement pattern to uncover key behavioral insights and identify patterns of interest?
✨
By integrating Location Log (24 Hours), Pinned Location, Activity Record, the platform enables users to intuitively replay a target’s movement, visualize their behavioral flow over time, and highlight key or suspicious locations—turning raw movement data into a clear behavioral narrative.
Solution 2: Multi-Target Correlation
🙋🏿♂️
As a user, I want to compare multiple targets’ top visited locations and activity records, so I can detect overlapping visits and potential group coordination.
👷🏻♀️
How might we enable users to compare individual and group data seamlessly to identify shared locations, synchronized movements, and possible connections between targets?
✨
Through Location Correlation, Phone Details, ID Data Details, and Location Overview, the system allows users to compare multiple targets side-by-side, uncover shared meeting points and identity links, and visualize coordinated movements—helping analysts detect possible group behavior and underlying network patterns.
LIVE PROTOTYPE
Please explore the live prototype to experience the finalized flow and design implemented in the final version.
Click “Expand Icon” to view it in full size for a better and more immersive experience.
MOBILE VERSION
I also designed a mobile version of the platform to provide a simpler and faster experience for users in field situations. Adapted from the desktop dashboard, it focused on quick access to essential features like search, check, and analysis, with layouts optimized for smaller screens and touch interactions. Advanced functions such as complex analytics and data export were intentionally excluded to keep the mobile app lightweight and efficient, allowing analysts to access critical insights anytime, anywhere.
LIMITATION & OBSTACLE
Data Latency
BTS data required up to 2 hours to process before insights could be generated, making real-time tracking impossible — despite user expectations for real-time updates.
Incomplete Data Sources
Some network providers (e.g., XL) restricted BTS data access, preventing complete location tracking and movement pattern analysis for certain targets.
Restricted User Testing
Due to the product’s use by high-security professionals, the design team couldn’t perform direct user testing. As a result, some features were underused, and development timelines were extended due to delayed feedback.
Complex Target Management
Each target needed unique color coding for better visibility on maps. However, in real scenarios with numerous targets, color availability was insufficient making it challenging to maintain clear visual differentiation.
IMPACT
For the Company
The product evolved into one of the company’s flagship solutions, successfully adopted by a government security institution in Indonesia. It generated significant annual contract-based revenue and strengthened the company’s position in the defense intelligence sector.
For the Users (Government Security & Defense)
Used in several high-risk investigations in Jakarta, the platform provided accurate, data-driven insights, enabling analysts to identify critical patterns and potential threats effectively.
GET IN TOUCH

© FENDRA PUNU. SENIOR PRODUCT DESIGNER (UI/UX). JAKARTA - INDONESIA. 2026. ALL RIGHTS RESERVED.